You’ll learn how to…
- Send a request to Aptos Node Service (both the REST API and GraphQL API)
- View your requests and error codes in your Shinami dashboard
- Get guidance on a specific error code in our Error guide.
Initial Setup
1. Create a Shinami account
You’ll need a Shinami account to follow this quick-start guide.2. Create an API Access Key
To use Shinami’s products, you need an API access key to authenticate your requests. Set up a Node Access key for Testnet as shown in our Authentication and API Keys guide. Since Aptos Node services is currently only offered in ourUS East - us1 region, you’ll need to switch to that region to make an API key.
Send a REST API Request
1. Make a request
Here is an exampleGET /accounts/address request that returns a not found error. We’re producing the error by sending an address that doesn’t exist. This is on purpose so we can show you how to use your dashboard and our error guide. We’ll fix the request below.
The TypeScript example uses the Shinami Clients SDK.
2. View the request and error in your dashboard
Visit the “REST API Insights” tab of the Aptos Node Service page in your Shinami dashboard in theUS-East - us1 region. Note that it can take a few minutes for a request to show up. If your request hasn’t shown up yet, just keep reading this doc to learn about the metrics and error guide, then refresh the insights page when you’re done.
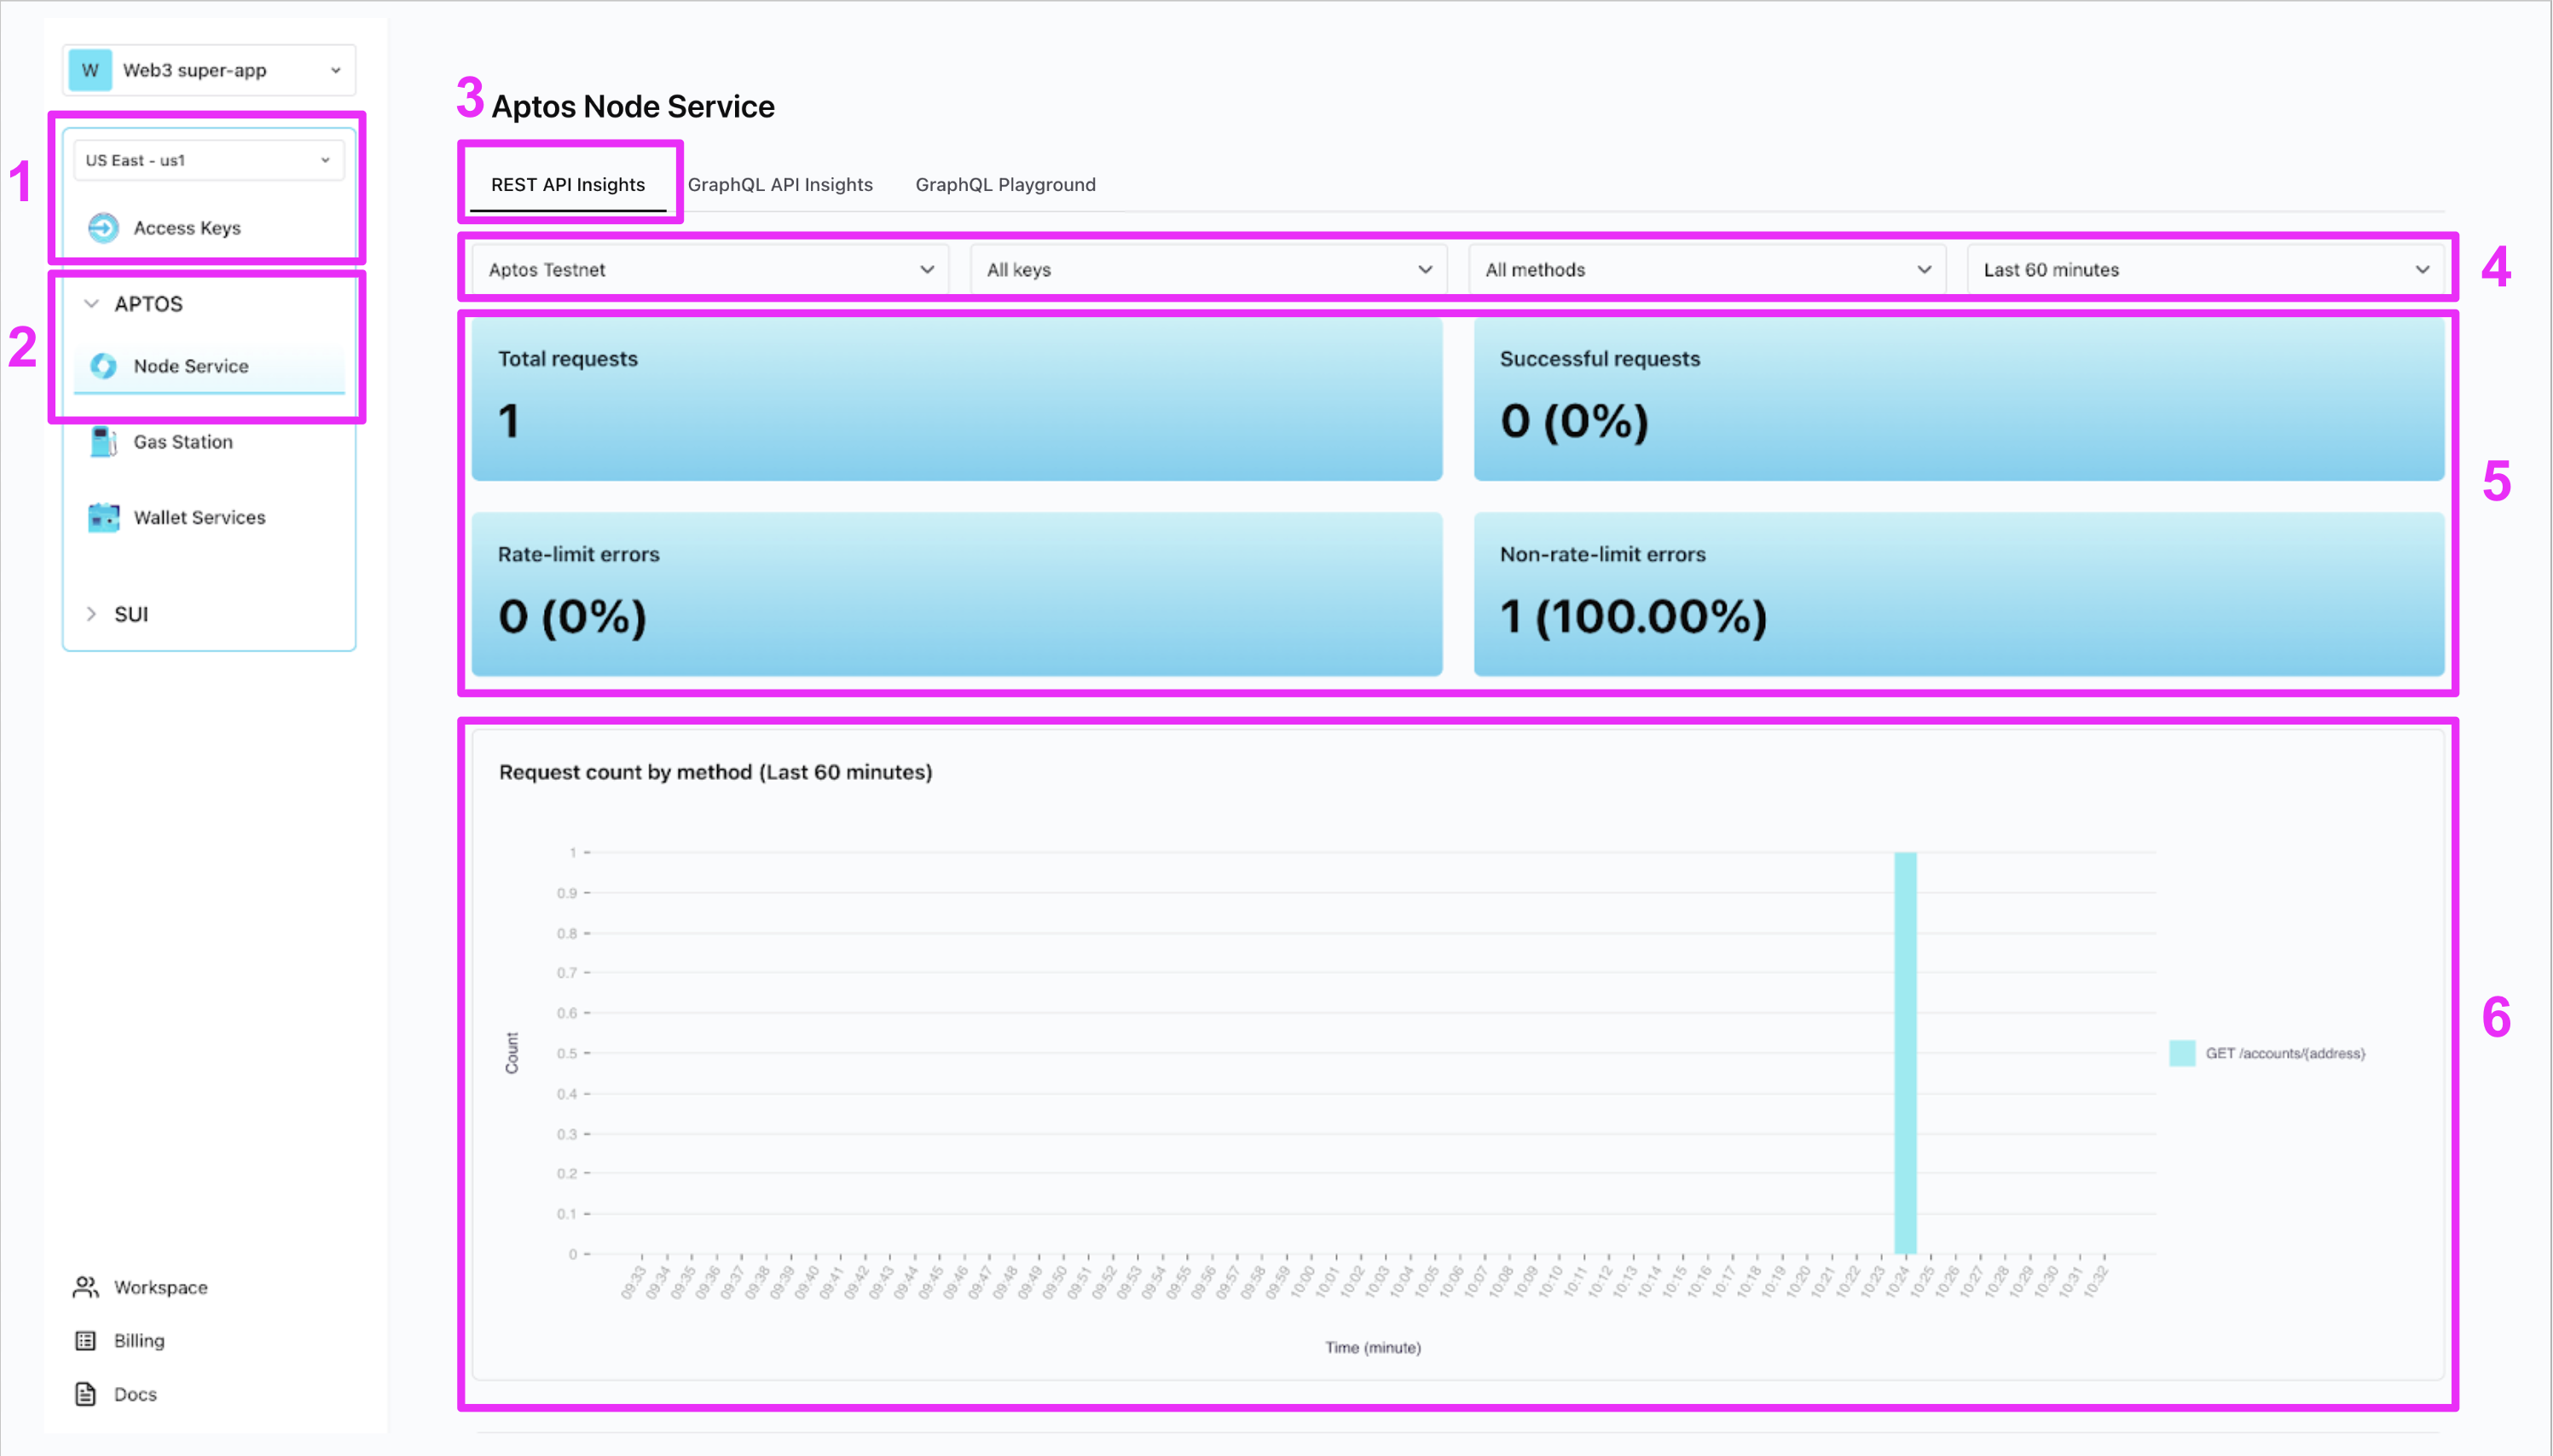
- Services exist within geographic regions. Here, we’ve selected
US East - us1since it’s the only region that currently hosts Aptos Node Service. API Access Keys are tied to a region, so we had to use an API key from this region to send the request (along with the region specific URL for this servicehttps://api.us1.shinami.com/aptos/node/v1). - Within a region, each service has its own page with its own API insights.
- Some services, like Aptos Node Service, have tabs to choose between multiple sets of insights. Select “REST API Insights”.
- Filters: I’ve chosen “Aptos Testnet” and “Last 60 minutes” to narrow down to this one error. You can also filter by a specific API key and by a specific method. The default is “All keys” and “All methods” as shown above.
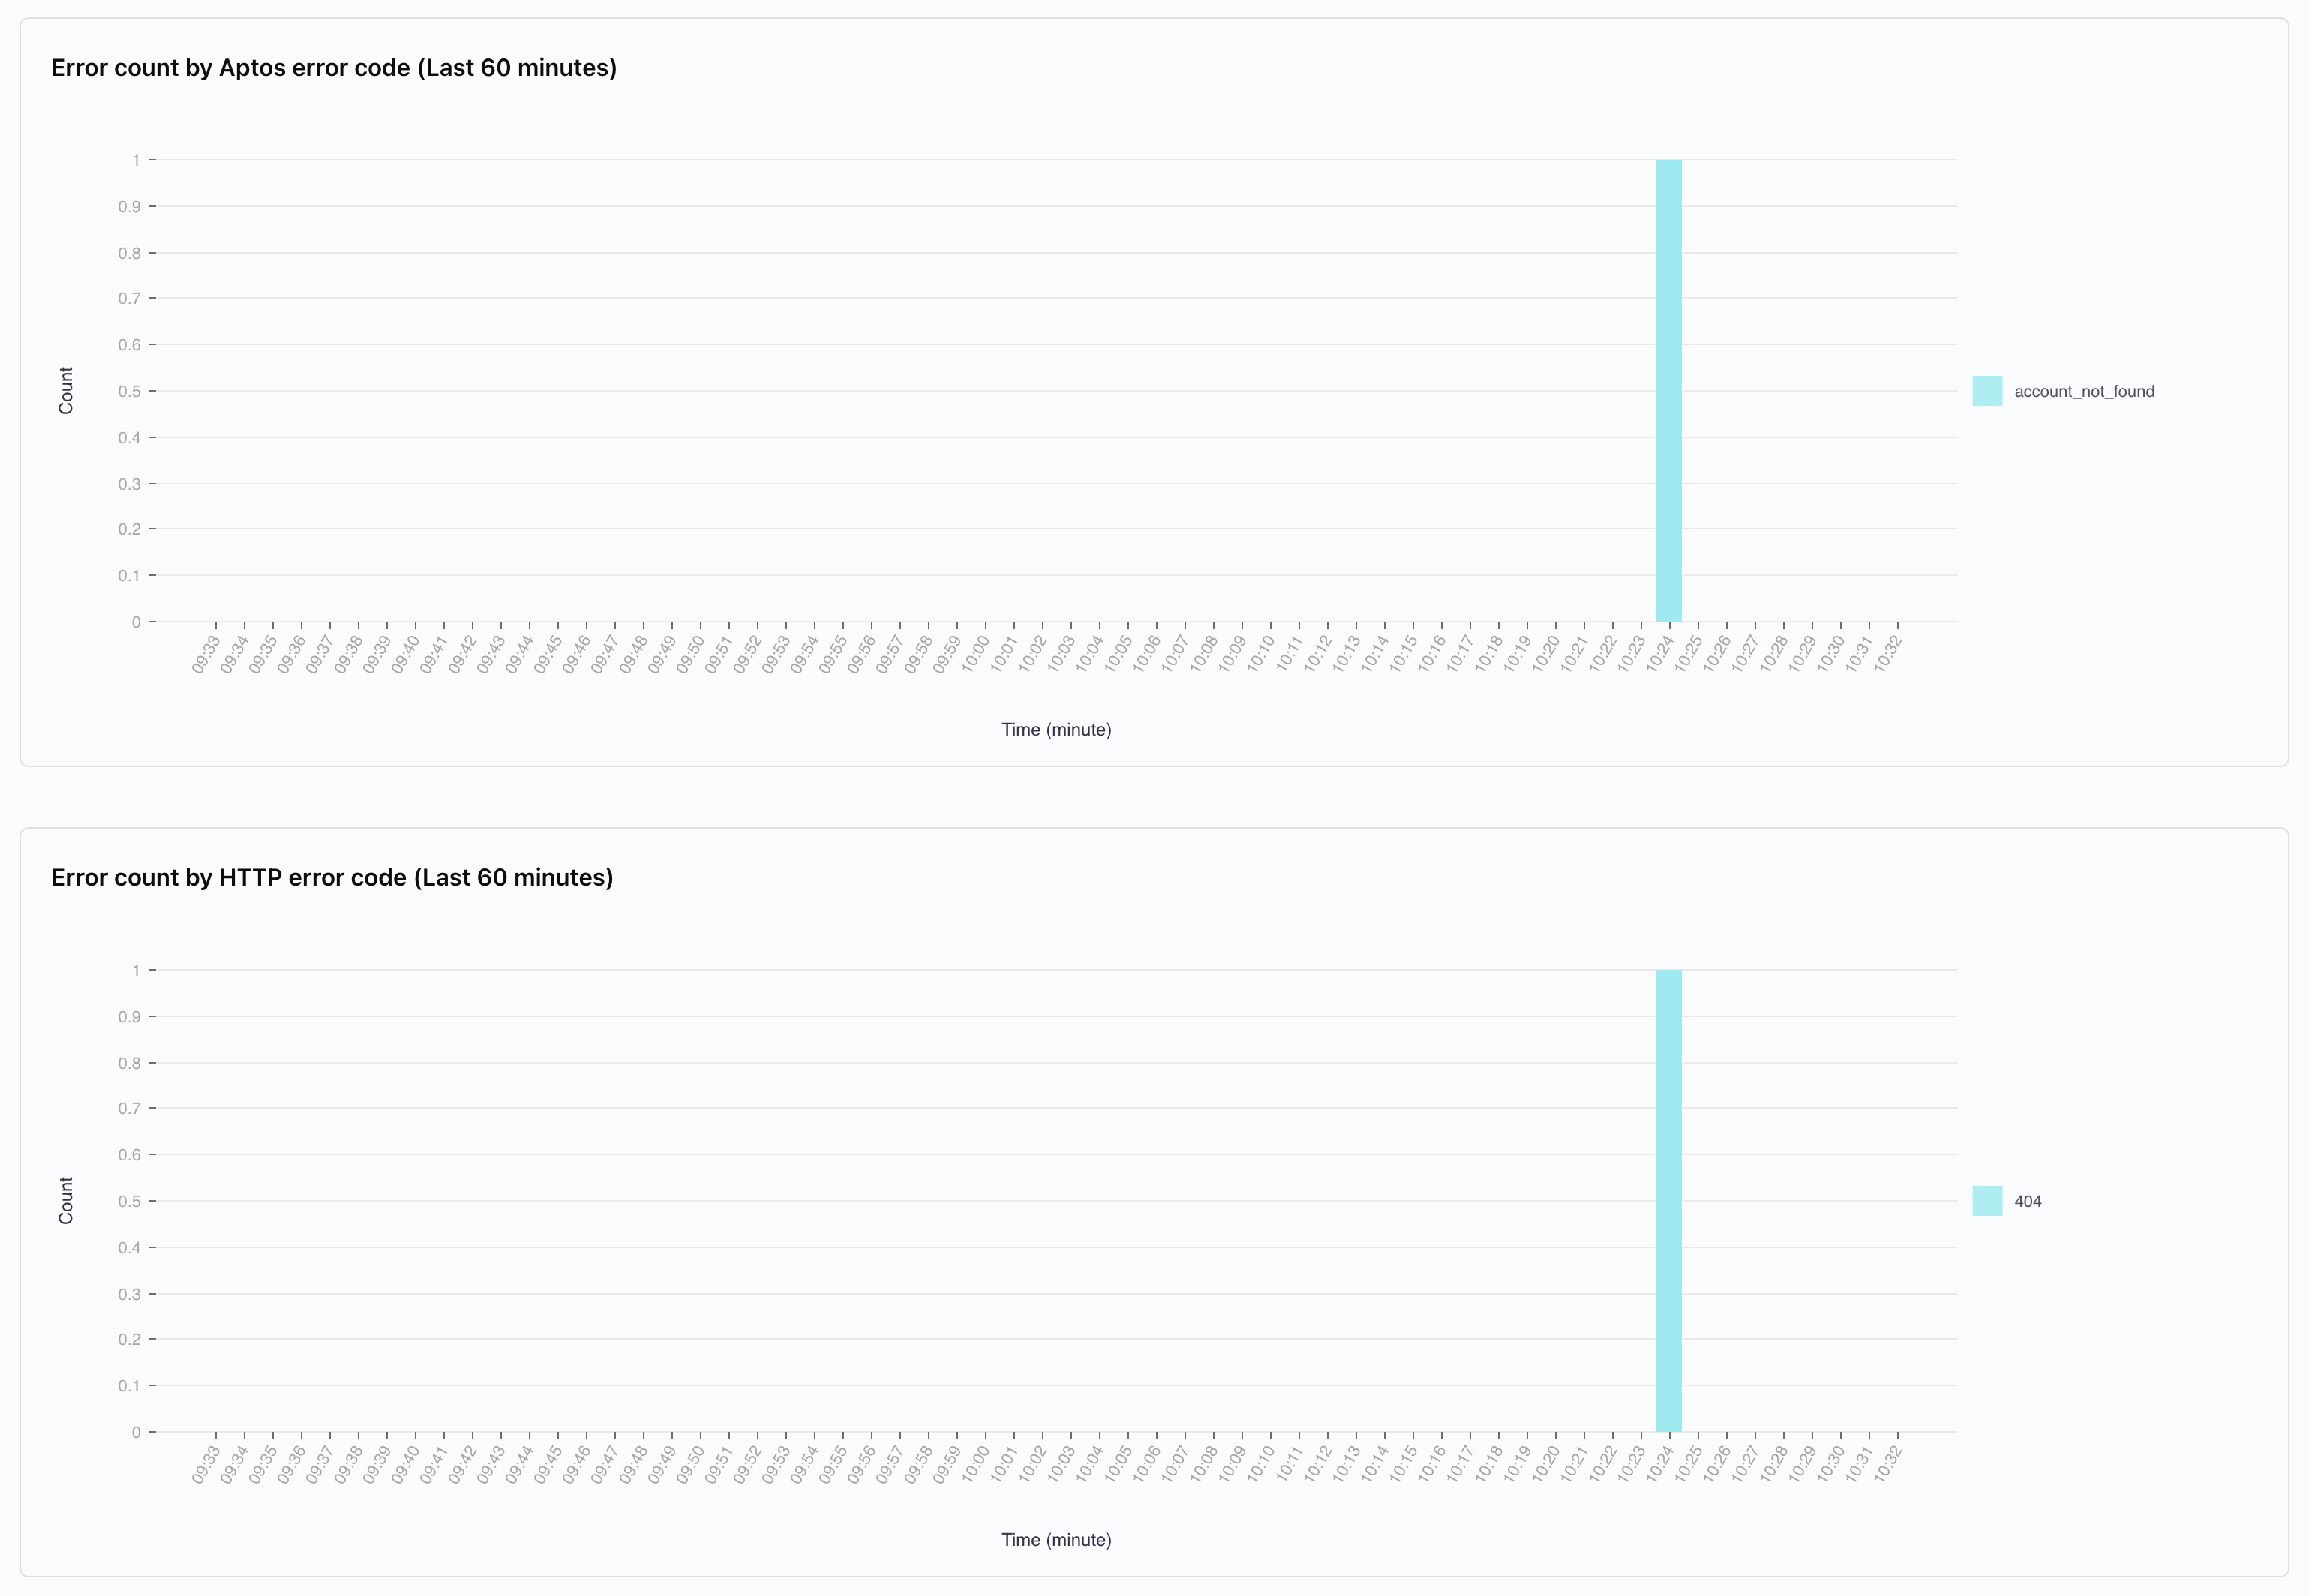
- Summary metrics: a great place to get a quick overview of your integration health. If there’s an issue - like a lot of rate-limit or other errors, you can scroll down to the graphs below to see more detail, like the time it occurred.
- Graphs: this is the first one, showing the request we’ve sent. If you sent more, you’ll see those as well, grouped by request name.
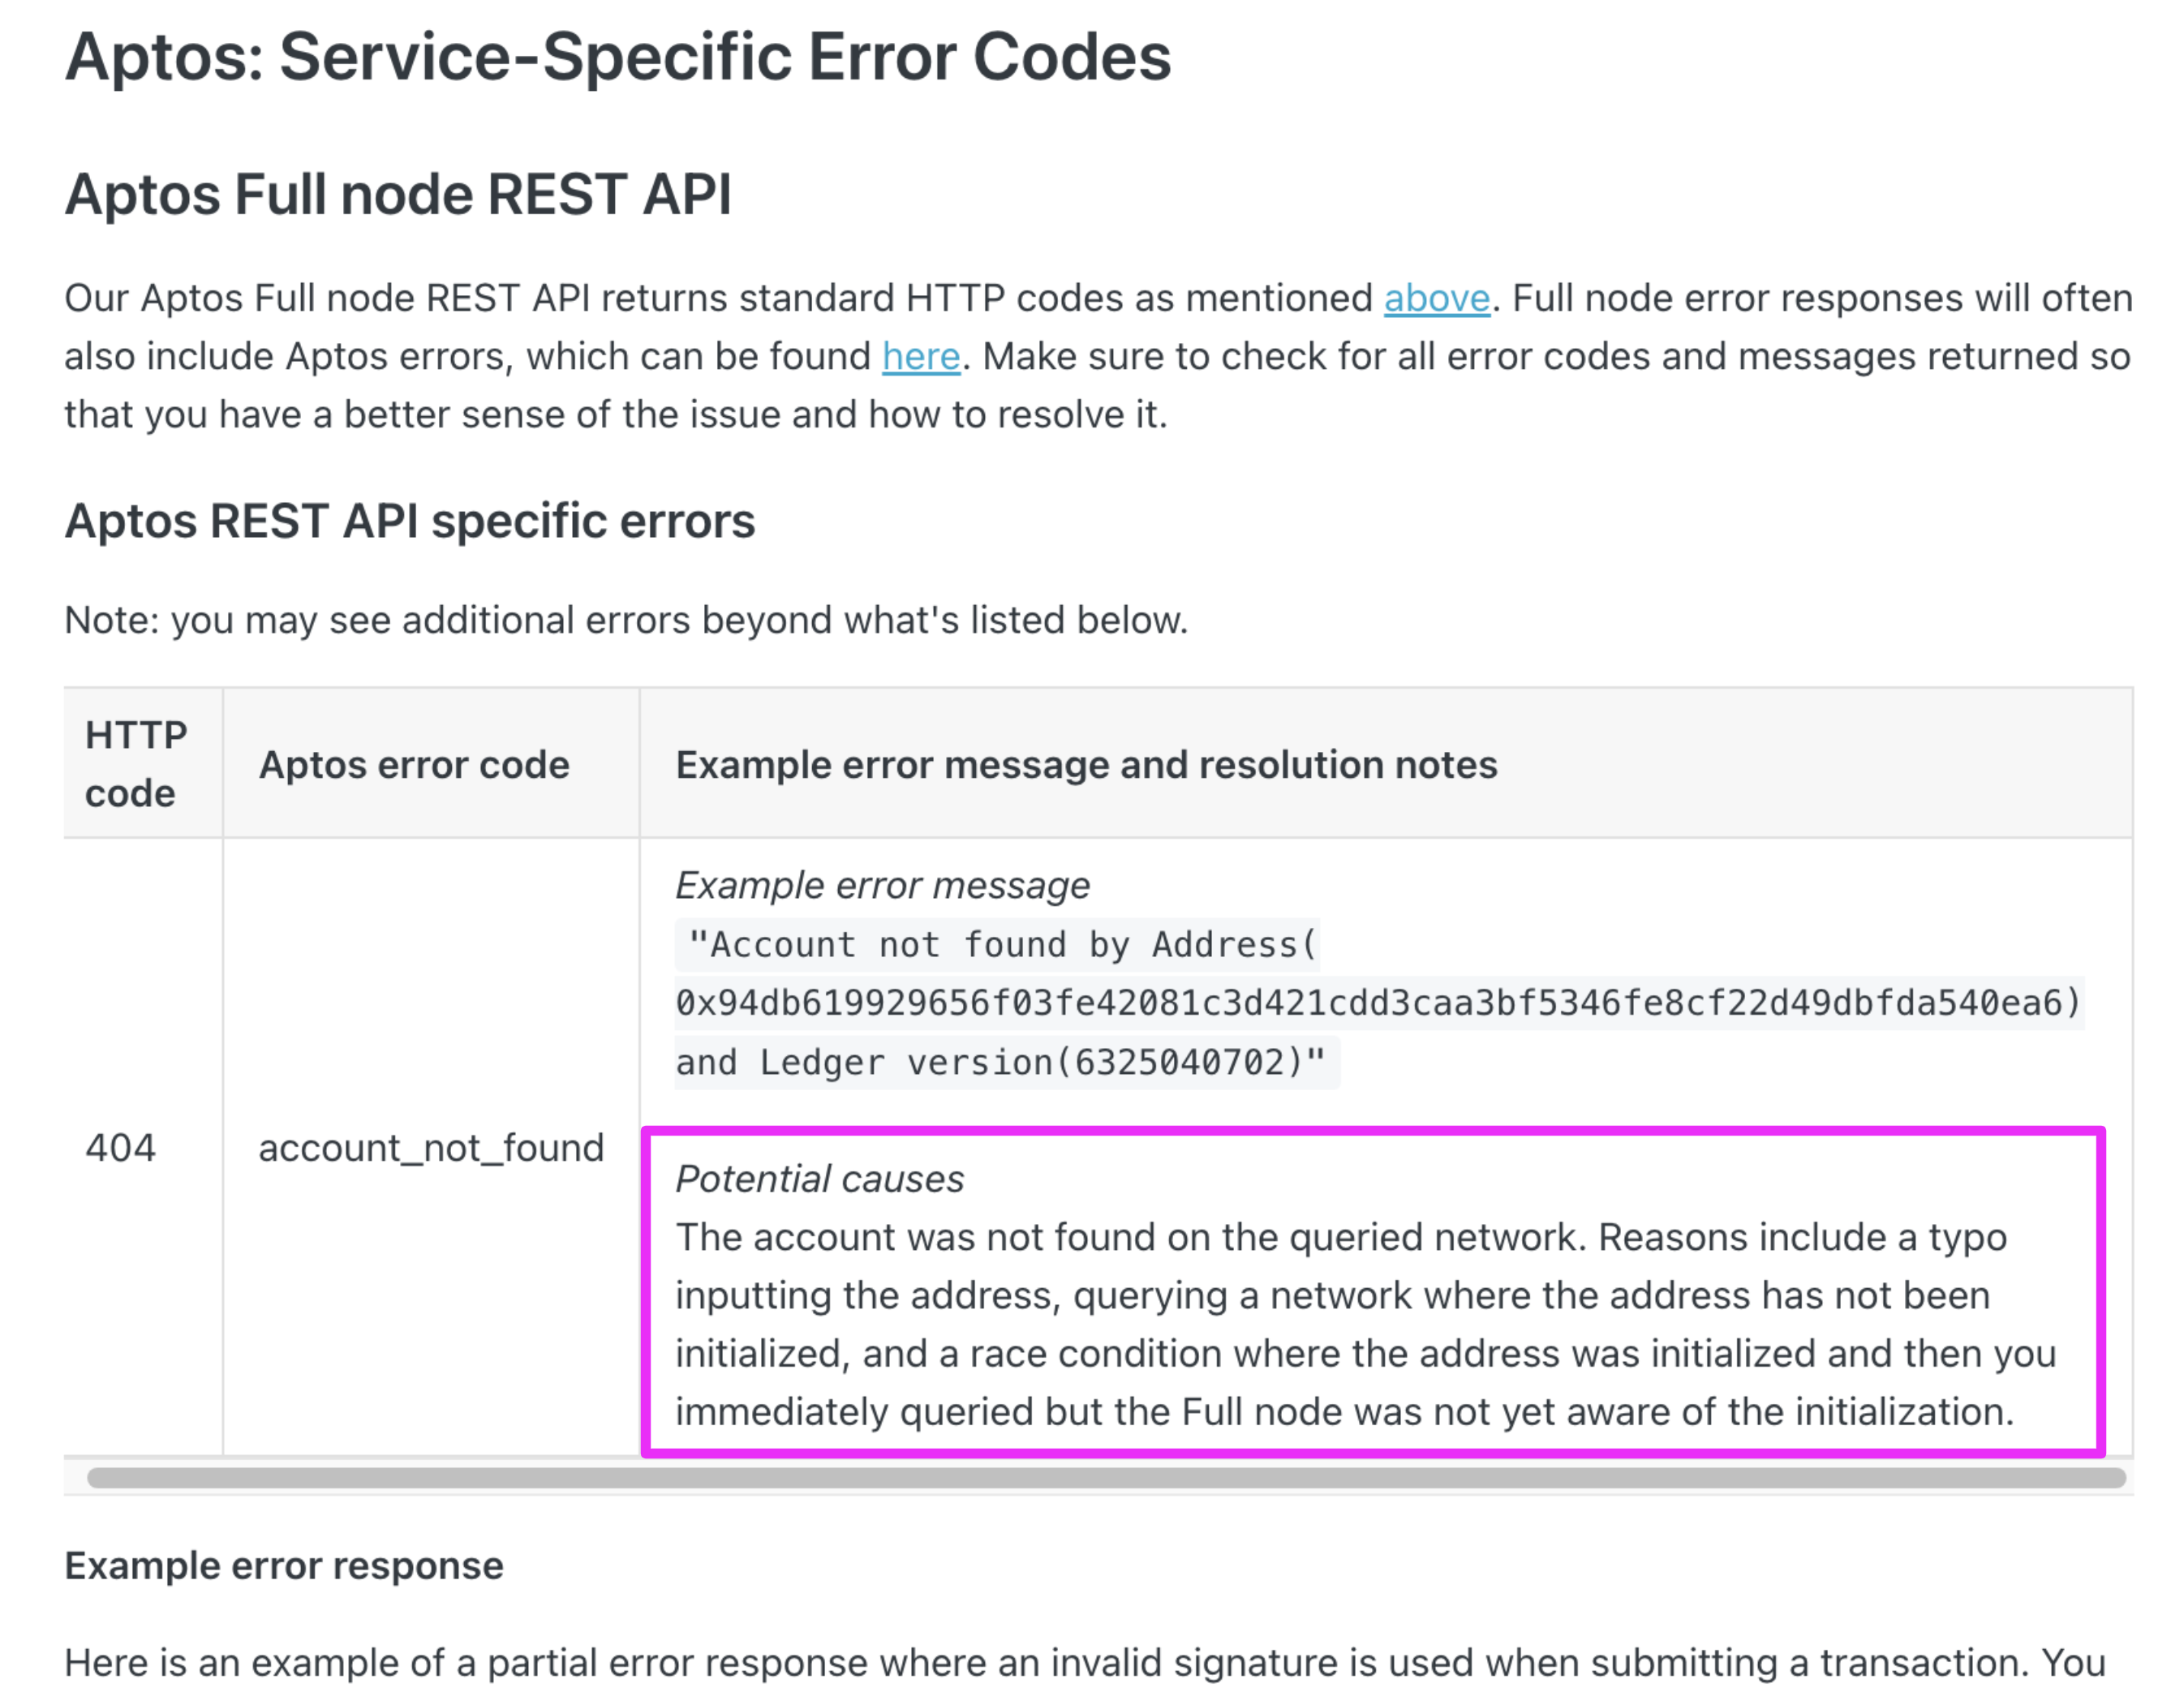
3. See what the error means in our Error guide
Our Error guide has an overall section for all Shinami Services, as well as a specific section for each service, including Aptos REST API. If we go there you can see a sample error, as well as guidance on different HTTP and Aptos error codes. In this case, we can see the potential causes of our404 account_not_found error.
4. Send a successful request
Our issue was a type. Let’s update the request to ask for a address we know has already been initialized on Testnet. Updated requestSend a GraphQL API Request
1. Make a request
Here is an example that queries the tokens currently owned by an account. However, something is wrong with it (on purpose so we can show you how to use your dashboard graphs - we’ll fix it below). Example Request The TypeScript example uses the Shinami Clients SDK.2. View the request and error in your dashboard
Visit the “GraphQL API Insights” tab of the Aptos Node Service page in your Shinami dashboard. Note that it can take a few minutes for a request to show up. If your request hasn’t shown up yet, just keep reading this doc to learn about the metrics and error guide, then refresh the insights page when you’re done.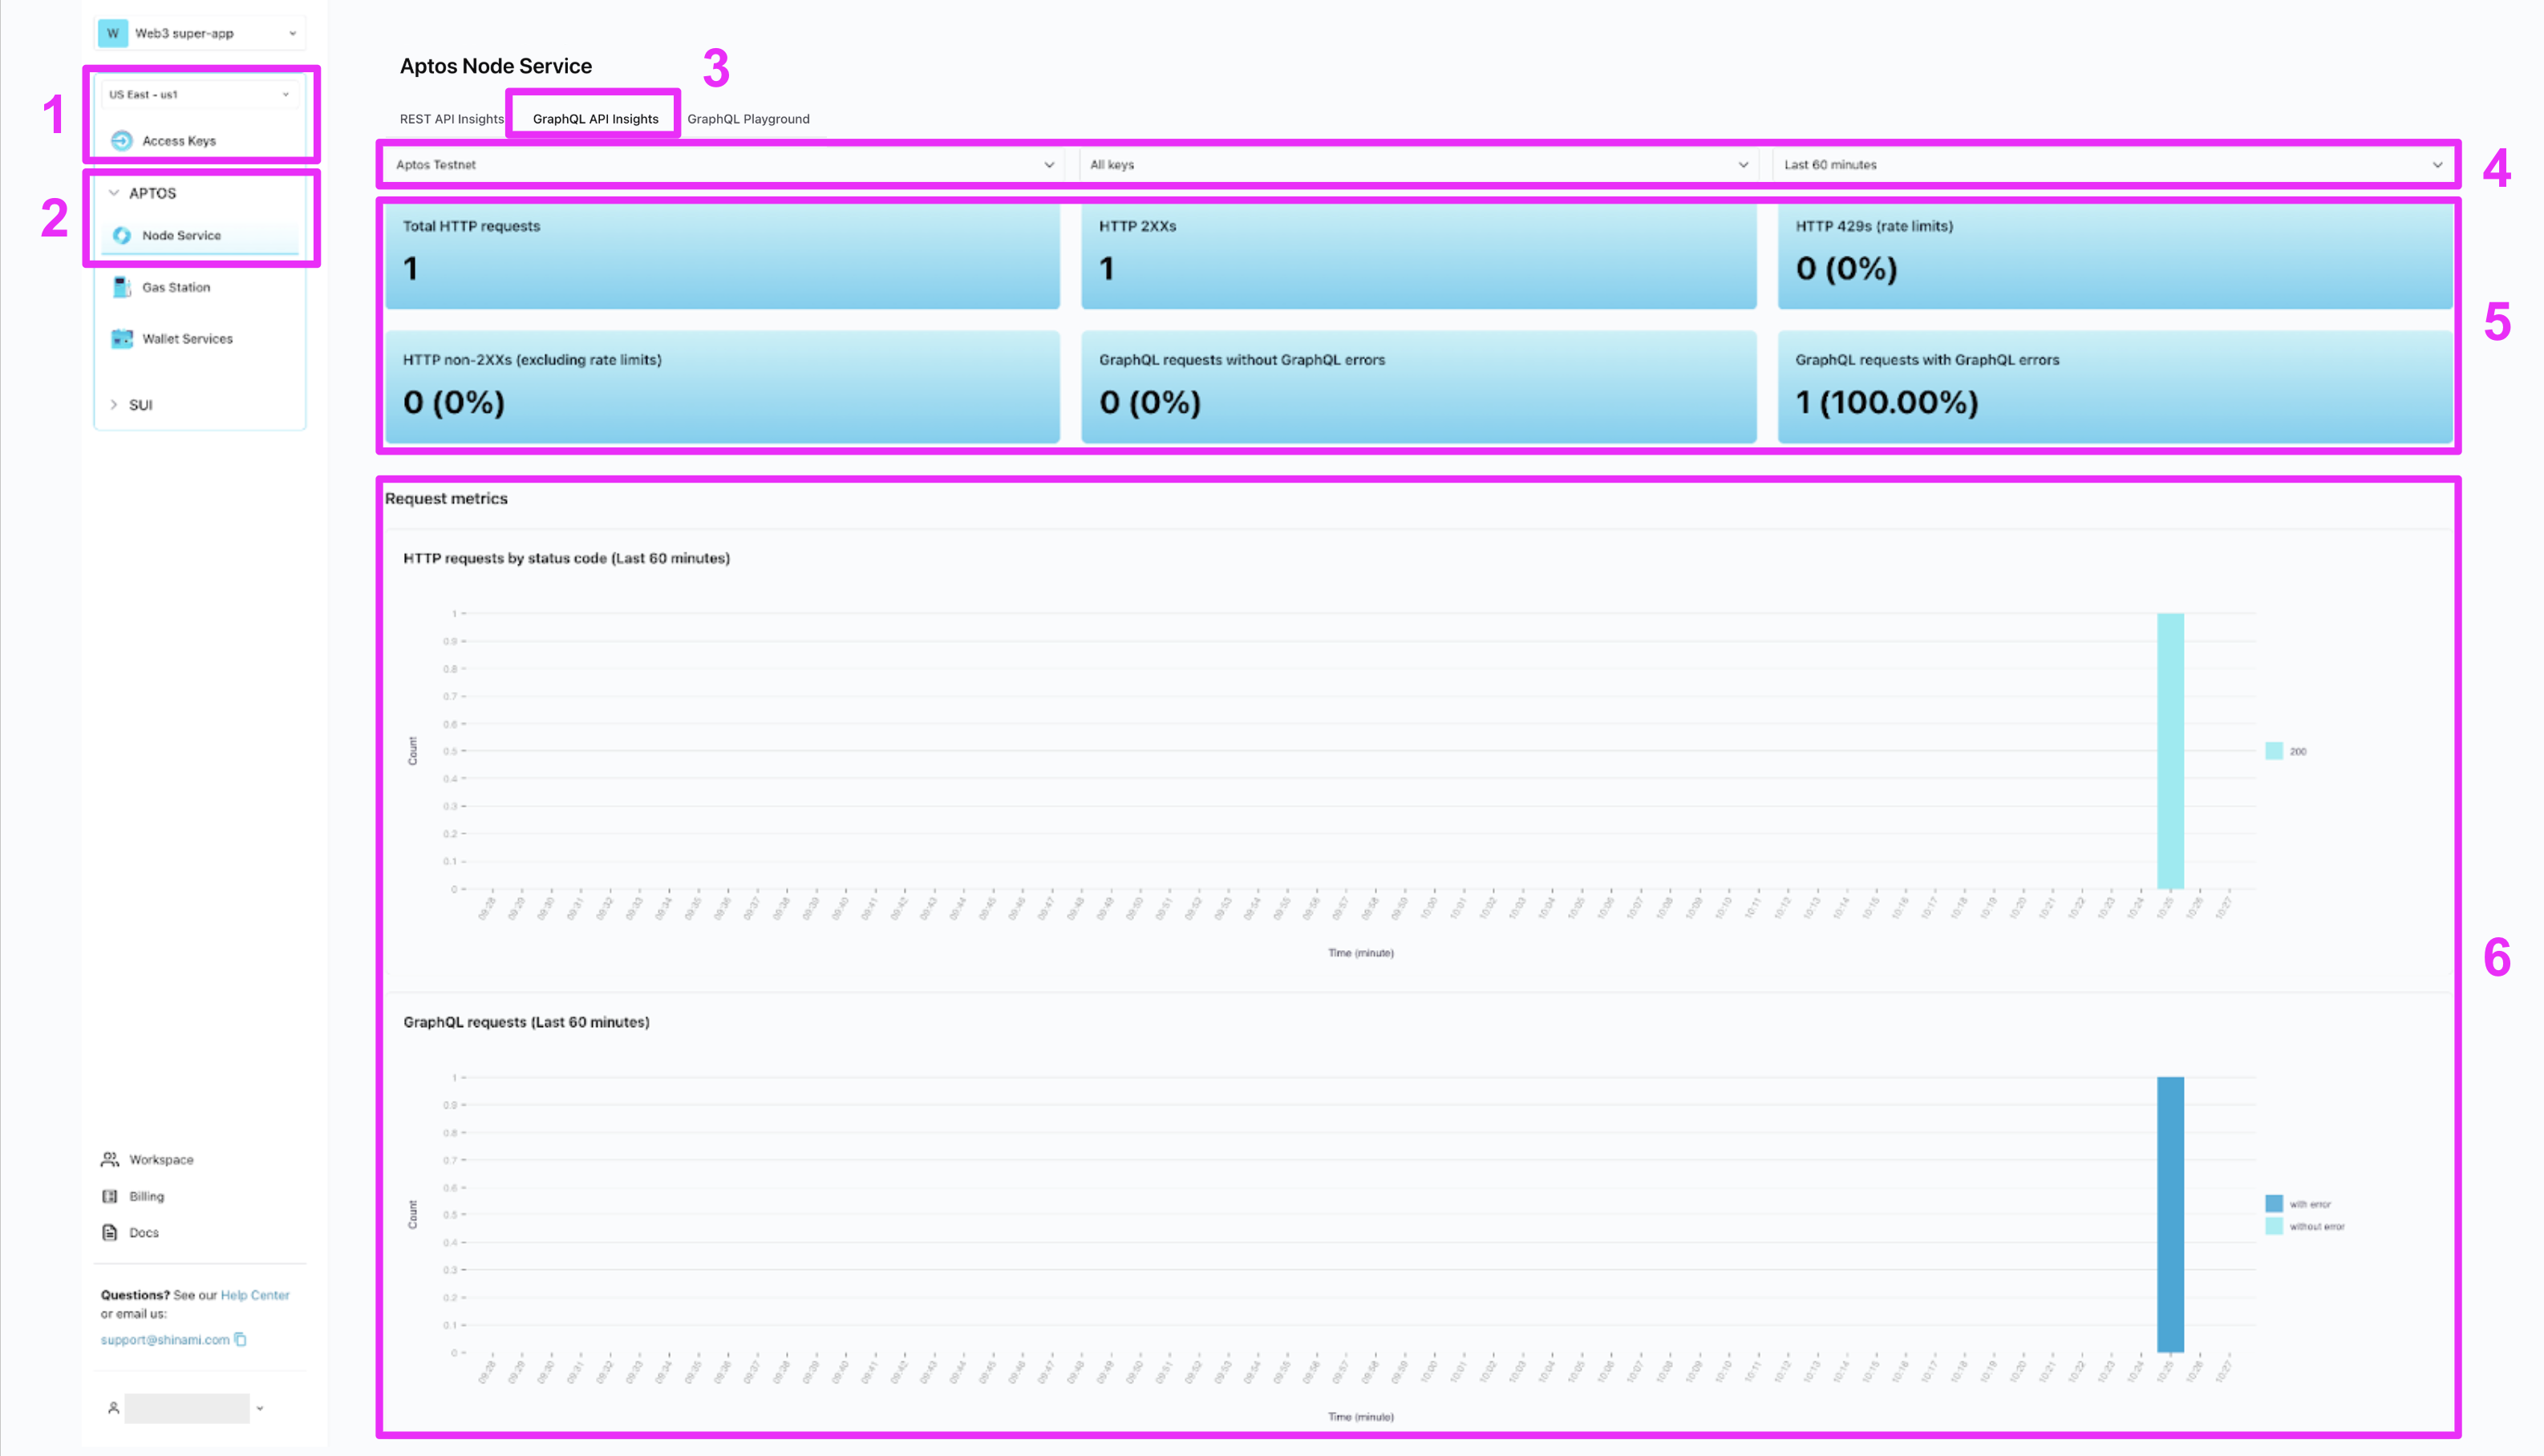
- Services exist within geographic regions. Here, we’ve selected
US East - us1since it’s the only region that currently hosts Aptos Node Service. API Access Keys are tied to a region, so we had to use an API key from this region to send the request (along with the region specific URL for this servicehttps://api.us1.shinami.com/aptos/graphql/v1). - Within a region, each service has its own page with its own API insights.
- Some services, like Aptos Node Service, have tabs to choose between multiple sets of insights. Select “GraphQL API Insights”.
- Filters: I’ve chosen “Aptos Testnet” and “Last 60 minutes” to narrow down to our request. You can also filter by a specific API key. The default is “All keys” as shown above.
- Summary metrics: a great place to get a quick overview of your integration health. If there’s an issue - like a lot of rate-limit or other errors, you can scroll down to the graphs below to see more detail, like the time it occurred.
- Graphs: the first graph shows the overall count of HTTP requests, and the second shows a breakdown of your GraphQL requests by those with and without a GraphQL error (because, technically, an HTTP request could have more than one GraphQL request).
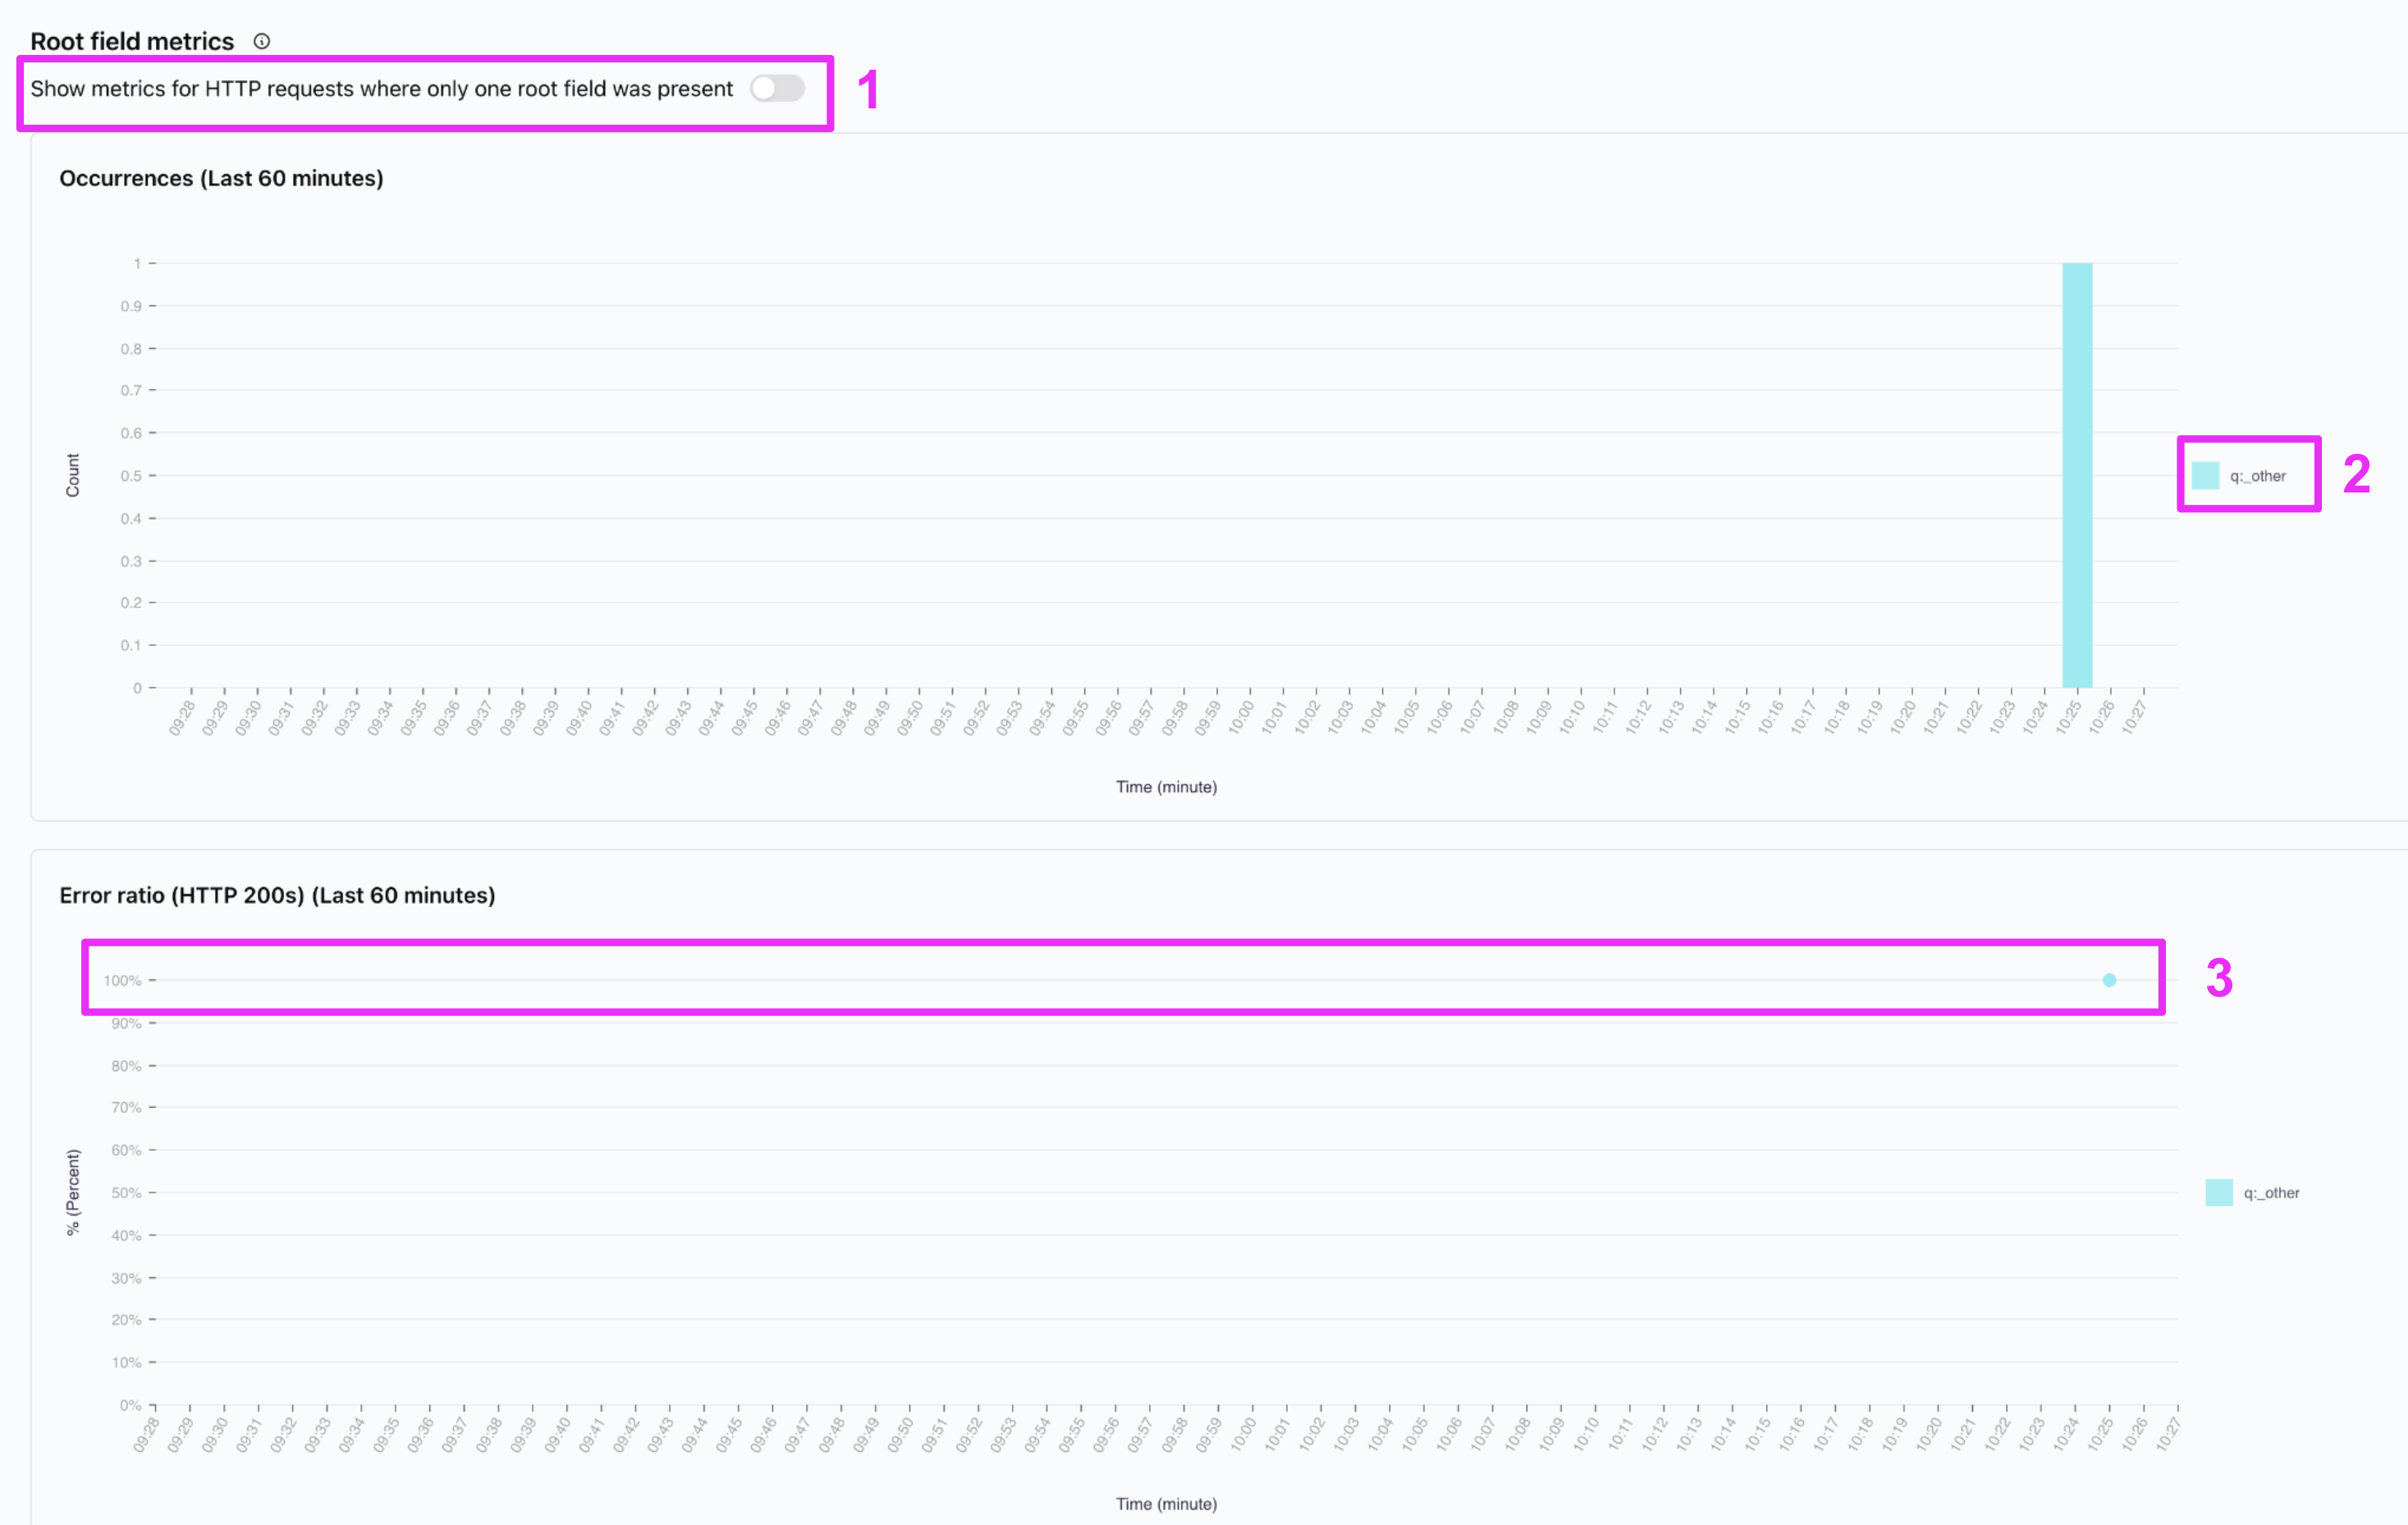
- You can toggle to only show requests with one root field present. This is especially useful for the latency graphs at the bottom of the page. You can learn more about this and see an example request with two root fields in our Help Center.
- When you send a root field we don’t recognize, we map it to
q:_other, whereqmeansquery. If you sent one we did recognize, likecurrent_token_ownerships_v2, it would show up asq:current_token_ownerships_v2. - The error ratio for
q:_otheris 100% in the minute I sent the event, as expected - 1/1 requests had an error. Note that this shows HTTP 200s, meaning the error in question is not an HTTP error but a GraphQL error.
3. Understanding and fixing the error
Our GraphQL API can return HTTP and GraphQL errors, as summarized in our Error Reference. The error we received was a GraphQL error that tells us that the validation failed with message"field 'current_token_ownerships_v0' not found in type: 'query_root'".
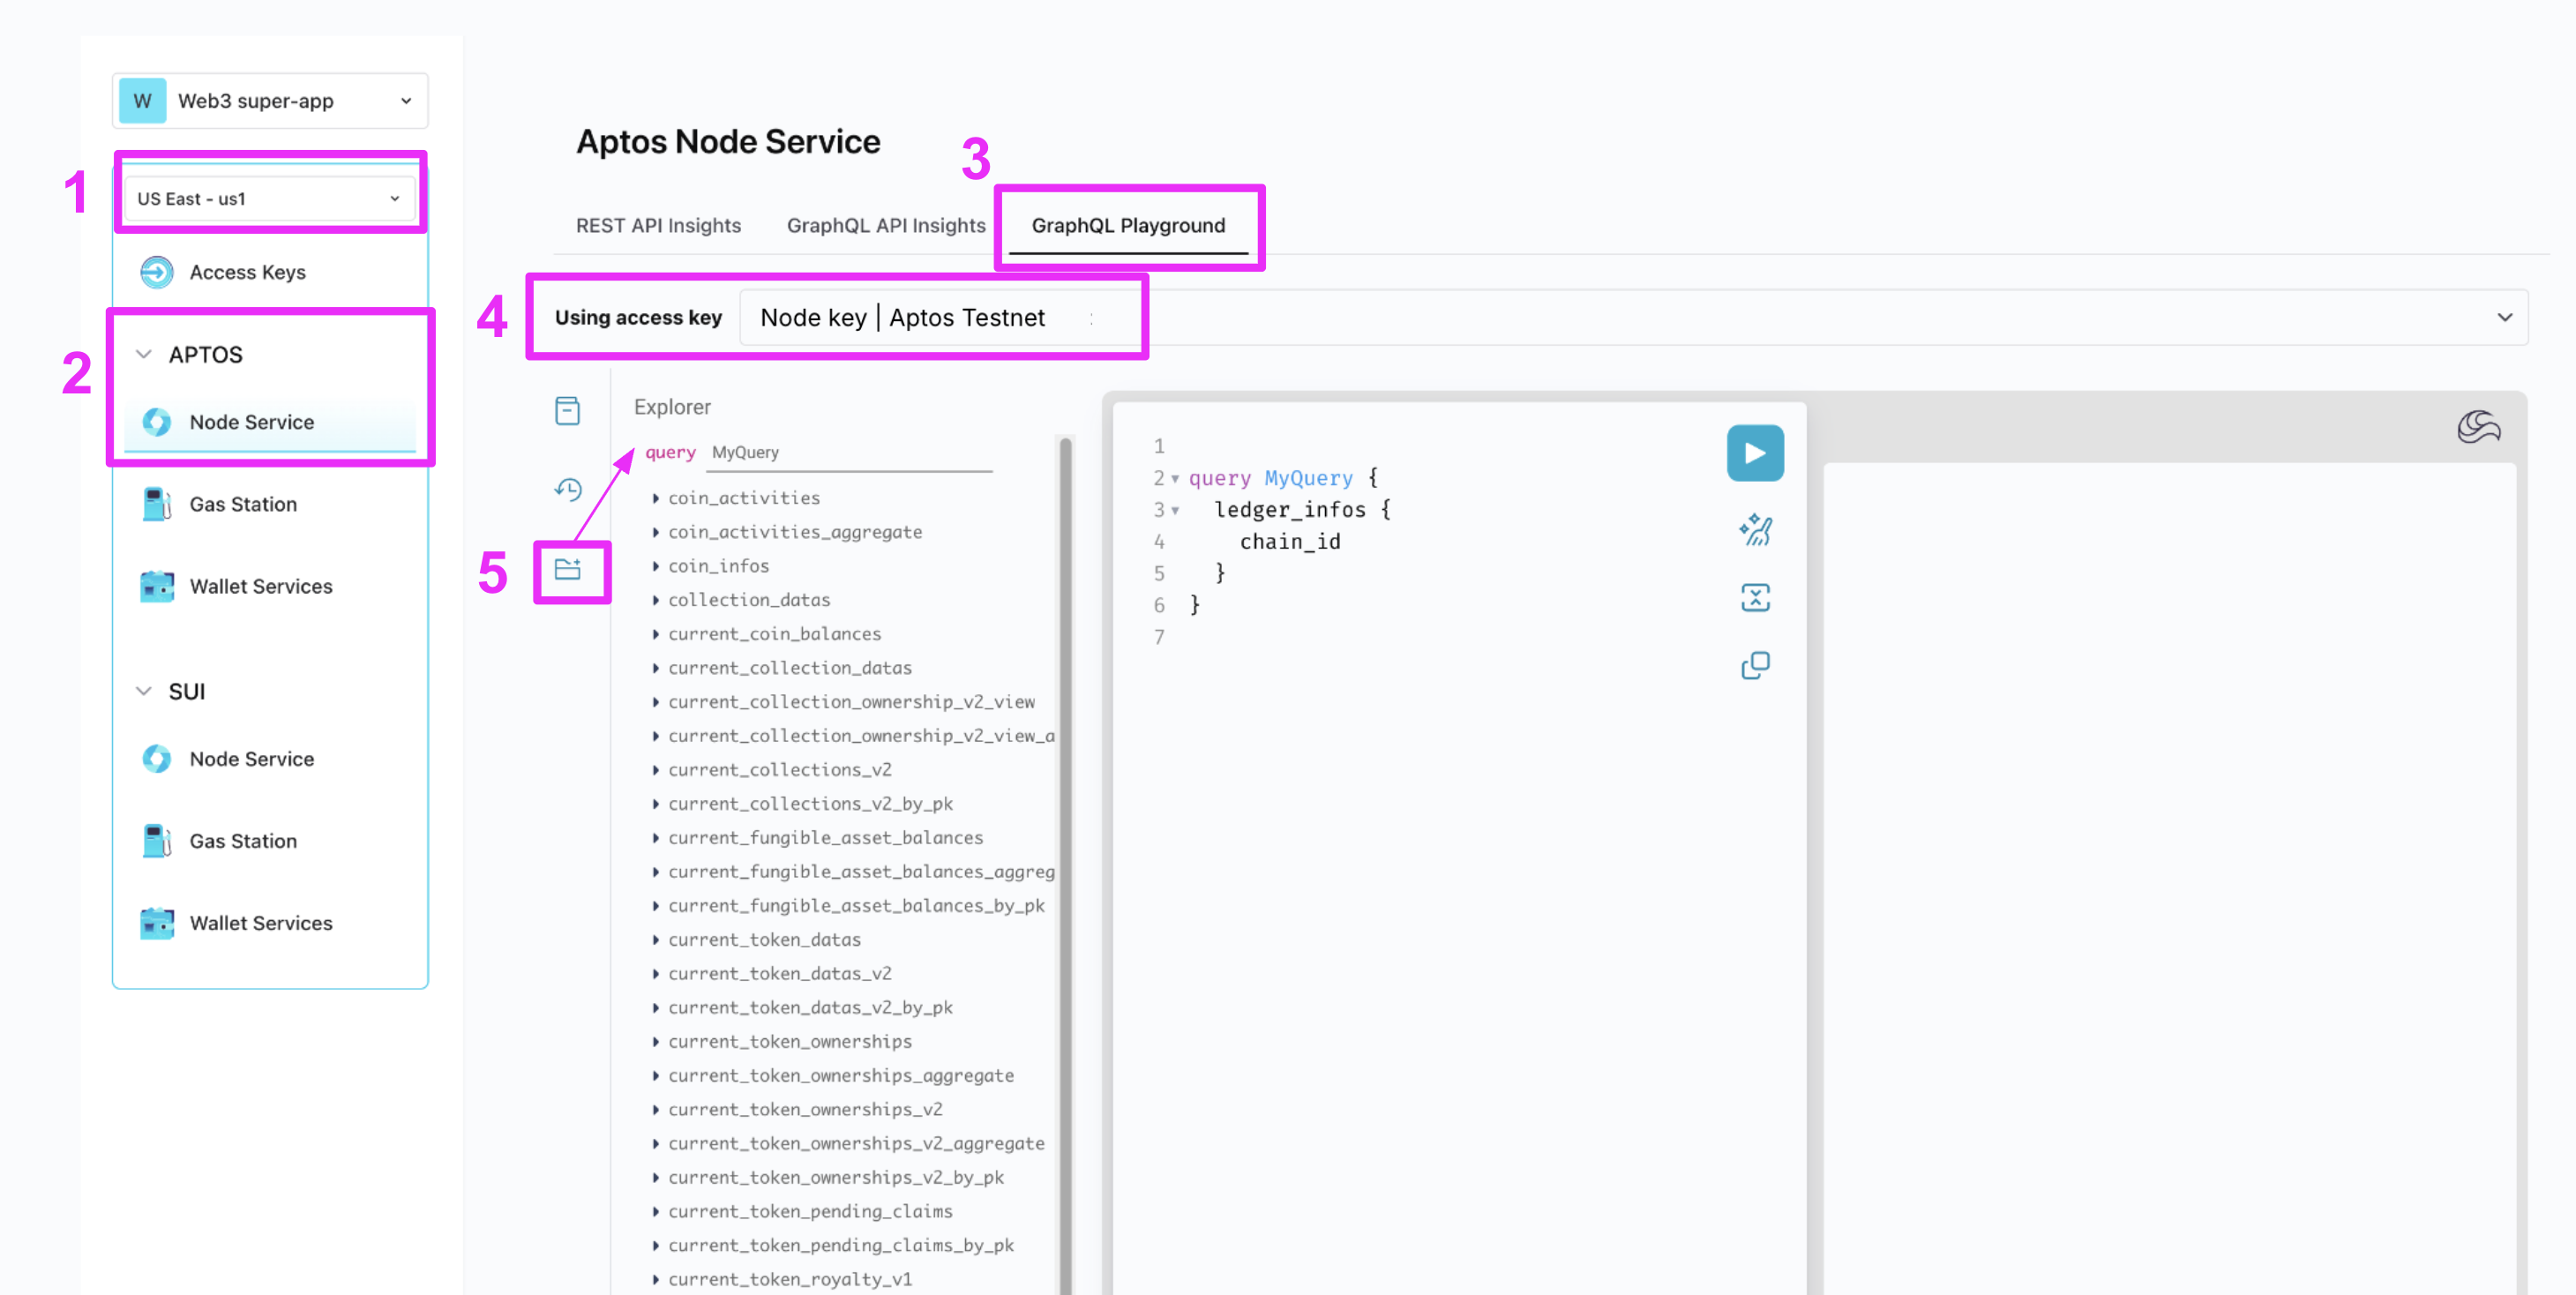
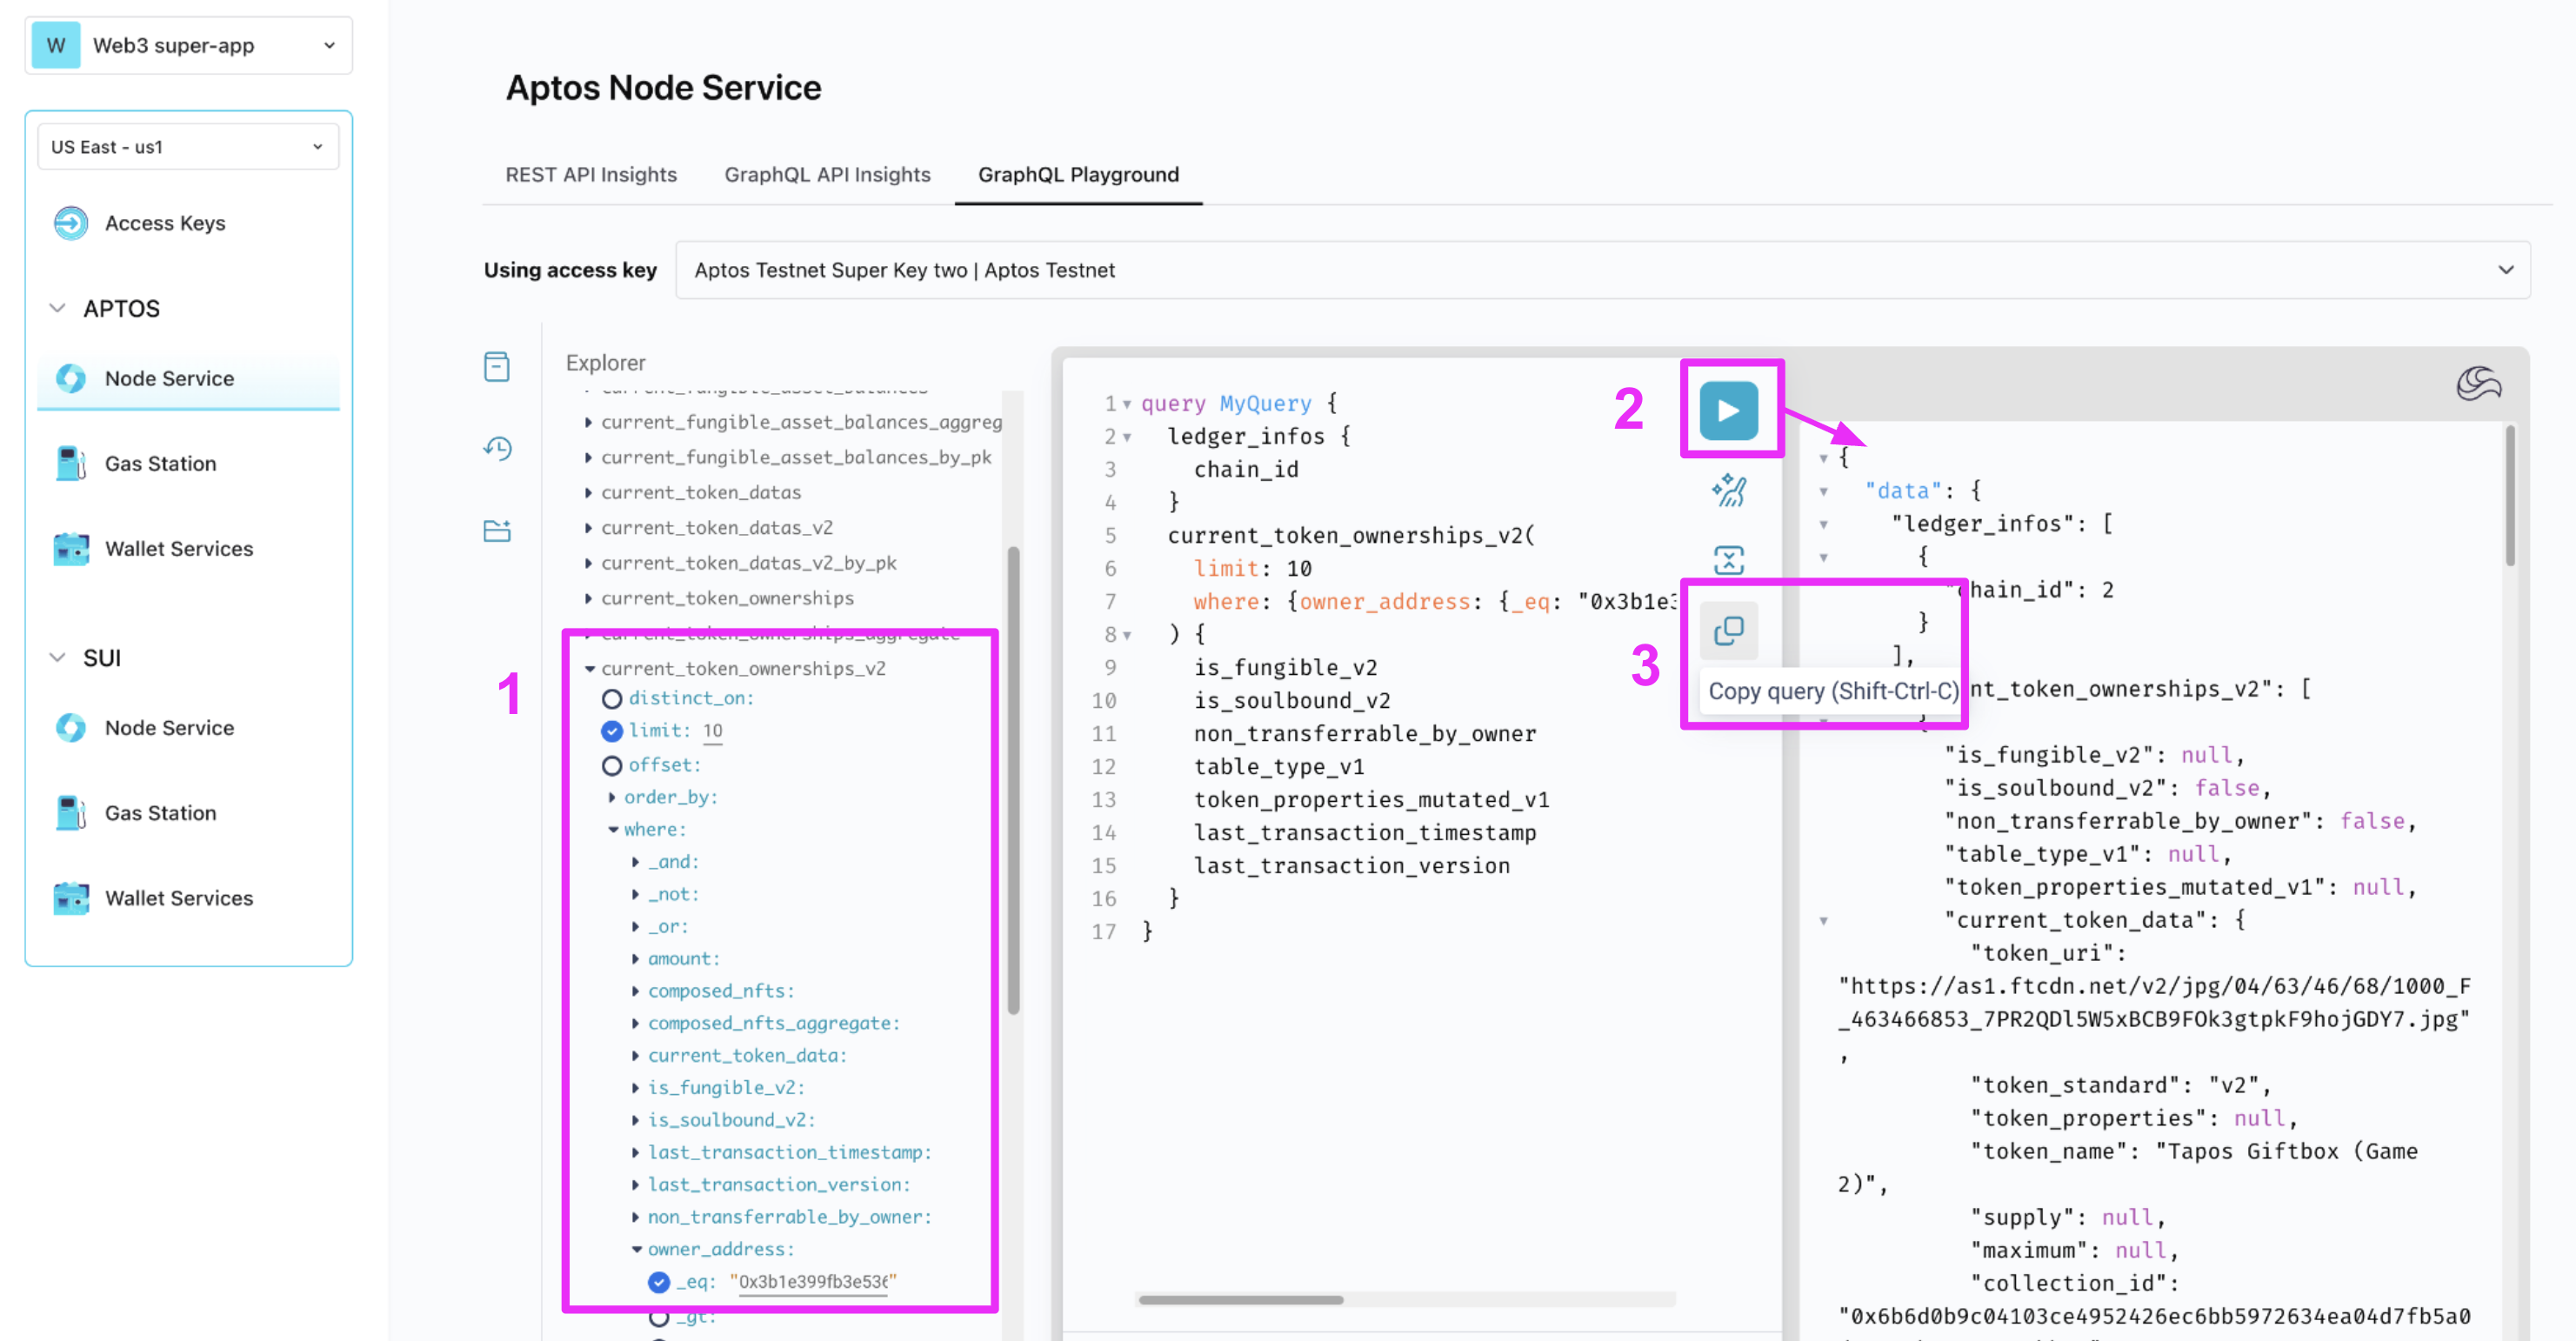
Indeed, current_token_ownerships_v0 is not a table you can look things up in. What we want is current_token_ownerships_v2. You can see the available tables and fields we support querying, and create and run sample queries, right in your dashboard! Just select the “GraphQL Playground” tab of your Aptos Node Service page. Then, select the access key you want to use (make sure it’s for Testnet). Using a key in the playground counts towards its CU and CUPS limits - this shouldn’t be an issue unless you set your CUPS value very low for the key or use a key here that you’re using live in production. Finally, click the folder icon on the left to show the explorer (step 5):
current_token_ownerships_v2 in the Explorer tab, add and remove filters and dimensions to your query, and then click the play button to run the query (step 2). If you’re happy with your query, you can copy it (step 3).
4. Send a successful a request
Below, we updated the requests to use the valid fieldcurrent_token_ownerships_v2. Note the addition of a new tab: “Shinami TypeScript SDK: built-in method”. Using the built in SDK methods will help avoid running into some naming issues because it will populate names for you. It may be good to start with these and write custom queries when you need more flexibility.
Example Request
The TypeScript example uses the Shinami Clients SDK.
Next step: build on Aptos!
- For an overview of our API docs, SDKs and tutorials for each of our services, see our API References Overview.
- For tips on learning how to code in Aptos Move, see Aptos Move Developer Resources
- Check out the Aptos Node Service product usage FAQ and billing FAQ in our Help Center for answers to common questions
- If you ever have questions, reach out to us.